
Financial Data Downloads
Three ways to take the data with you: prepared on the website as CSV, built into a finished file by your AI assistant in CSV, Excel, PDF or JSON, or pulled straight into your own systems through the API, where whole-universe bulk downloads also live. All three read the same normalized, audit-ready database, so a figure never changes depending on how you fetched it.
What your subscription includes
Website CSV reports and AI assistant report files come with a paid subscription. The API starts at Professional. Whole-universe bulk downloads are available under a Commercial License, with licensing based on usage, scope and distribution rights.
Choose your planFor bulk ingestion, redistribution or organization wide deployment, contact data.info@csimarket.com.
All three routes draw from the same CSIMarket database. What differs is how you ask for the data and what shape it arrives in: a report prepared on the page, a finished file built to your request, or rows delivered into your own system.
1. On the website
Reports are prepared on the site and download as CSV. Nothing to install and nothing to configure: open the company, industry or sector you are working on and take the figures with you.
- Prepared on the page you are reading
- CSV, opens in Excel, Numbers or Sheets
- The same normalized figures the page shows
- No data engineering required
2. Your AI assistant
Connect your AI assistant to the CSIMarket MCP server and ask for what you want in plain language. It retrieves the data and hands back a finished file. This is where custom datasets come from.
- CSV, Excel, PDF and JSON
- 31 exportable datasets
- Custom scope from a simple prompt
- Works in Claude, ChatGPT and other MCP clients
3. API ingestion
Pull data straight into your own research platform, warehouse, model or dashboard. This is the programmatic route, and it is also where whole-universe bulk downloads live.
- Direct retrieval on your own schedule
- JSON and CSV, cursor paginated
- Asynchronous export jobs for the largest pulls
- Bulk all-companies downloads with a commercial licence
Side-by-Side Comparison
| Website | AI assistant | API | |
|---|---|---|---|
| You get | A report prepared on the page | A finished file built to your request | Data inside your own system |
| Formats | CSV | CSV, Excel, PDF, JSON | JSON, CSV |
| How you ask | Click, on the page you are reading | A plain-language prompt | An HTTP request from your code |
| Scope per file | What the page covers | Whatever you describe, across companies and periods | Anything up to whole-universe bulk |
| Best for | Taking a figure into a spreadsheet | Research and analysis that keeps changing shape | Pipelines, warehouses, models, dashboards |
| History | Up to 20 years across all three routes | ||
| Repeatable | Manually | Ask again, or change the question | Automated |
| Data engineering | Not required | Not required | Yours to build, on your own stack |
| Typical users | Analysts, CFOs, strategy teams | Analysts, consultants, researchers, small teams | Quant teams, data engineers, portfolio and risk systems |
| Included with | Every paid subscription | Every paid subscription | Professional and Enterprise, bulk under a commercial licence |
What each subscription brings
Every paid plan carries the same data breadth. What changes is how you are allowed to take it out.
Individual
A working analyst with an AI assistant. Web access plus MCP, so the assistant does the gathering and hands you the finished file.
- Website CSV reports
- AI assistant files: CSV, Excel, PDF, JSON
- Custom datasets from a prompt
- 120 requests per minute
Professional
Everything in Individual, plus the API. For teams building their own research platform, models or internal dashboards on CSIMarket data.
- Everything in Individual
- Full API access, 114 research endpoints
- Programmatic retrieval into your own systems
- Relationship evidence and segment detail
- 300 requests per minute
Enterprise
Everything in Professional, plus whole-universe bulk downloads and an organization wide licence. The commercial tier.
- Everything in Professional
- Bulk all-companies statement downloads
- Asynchronous CSV and JSON export jobs
- All 126 research endpoints
- Organization wide, 600 requests per minute
| Download capability | Individual | Professional | Enterprise |
|---|---|---|---|
| Website CSV reports | Included | Included | Included |
| AI assistant exports over MCP | Included | Included | Included |
| CSV, Excel, PDF and JSON report files | Included | Included | Included |
| Full API access | Not included | Included | Included |
| Bulk all-companies export | Not included | Not included | Included |
| Organization wide deployment | Not included | Not included | Included |
| Request capacity | 120 / min | 300 / min | 600 / min |
Reports On The Website
Prepared on the page you are reading, downloaded as CSV. Included with every paid subscription.
The simplest route, and the one that needs nothing set up. While you are reading a company, industry or sector page, the figures on it can be taken away as a CSV file and opened straight in a spreadsheet. It is the same normalized data the page displays, so what you download matches what you just read.
What is included
- Reports prepared on the site, no configuration and no waiting
- CSV, which opens in Excel, Numbers, Google Sheets or any script
- Human readable column headers rather than raw database field names
- The same figures, definitions and periods shown on the page itself
- Included with every paid subscription
Custom Report Downloads
Generated by your AI assistant over the MCP connection, in CSV, Excel, PDF or JSON. Included with every paid subscription.
This is how custom datasets are produced now. You describe the file you want in plain language, your assistant works out which datasets it needs, retrieves them and hands back a finished file. No configuration screens and no data engineering: the scope is whatever you asked for.
What is included
- CSV for anything, Excel with typed numeric cells, PDF to read or circulate, JSON for code
- 31 exportable datasets, from statements and ratios to quant factors and market performance
- Any scope you can describe: the companies, industries, metrics and periods you name
- Company against peer group, with industry benchmarks alongside
- Excel cells keep full precision and only display rounded, so a model is not built on rounded inputs
- Works in Claude, ChatGPT and any MCP compatible client
Reports people ask for
- Profitability Benchmarking: margin structures against industry peers
- Growth Comparison: revenue, earnings and cash flow growth against competitors
- Valuation Snapshot: P/E, P/S, P/FCF and other multiples against the sector
- Financial Strength: leverage, liquidity and capital structure analysis
- Management Effectiveness: ROA, ROE, ROI and efficiency ratios
- Industry Aggregate: sector level summaries for regulatory or board use
What a request sounds like
- Export NVDA quarterly income statements for the last five years as Excel.
- Give me valuation multiples for every company in the semiconductor industry as CSV.
- Build a PDF report on the profitability of these eight companies against their industry.
- Export the quant factor panel for my watchlist so I can load it into my model.
Report files are per request, not a database dump: the whole-universe extract is the bulk route above. An export that would exceed the size limit is refused with a note to narrow it, never silently cut short. Report generation unlocks the file formats, while the underlying dataset stays governed by your own subscription, so a file can never contain data your plan does not include.
API Access & Bulk Downloads
Programmatic retrieval into your own system, from Professional up. Whole-universe bulk downloads under a commercial licence.
The API is the route for work that has to run unattended and repeatedly: a licensed key, an HTTP request, and the data lands in your own research platform, warehouse, model or dashboard. The same route carries the whole-universe bulk statement downloads, which is the only way to take every company in one pull.
What is included
- Company, industry, sector and total-market data over one licensed key
- Bulk statement endpoints returning flat rows built for ingestion, not for display
- A public field dictionary and OpenAPI specification, so you can generate a client
- Rolling TTM calculations and YoY and QoQ deltas already computed
- Annual, quarterly and TTM periods across up to 20 years of standardized history
- Stable identifiers for longitudinal joins across periods
How delivery works
- Direct requests on your own schedule, no delivery window to wait for
- Cursor pagination on the large sets, so a pull can resume rather than restart
- Asynchronous export jobs for the biggest pulls: start the job, collect the file
- JSON and CSV, loadable into SQL, BigQuery, Snowflake, Redshift and most BI tools
Available through the API
Every CSIMarket dataset is reachable through the API, and the statement datasets are also available as whole-universe bulk downloads.
Industry Benchmarking Dataset
Institutional-grade industry benchmarking framework covering profitability, growth, valuation, financial strength, and efficiency across hundreds of industries. Structured for risk, compliance, and quantitative modeling workflows.
- Cross-sectional distributions (median, p25, p75, stddev)
- Industry percentile rankings & composite scoring
- Revenue, margin, and growth dispersion analytics
- Designed for AML/KYC, credit risk, and portfolio monitoring
Additional custom datasets can be scoped on request.

Example: a bulk dataset delivery.
How institutional-grade data is used
However you take the data out, it supports the same professional workflows, from a single-company deep dive to multi-factor quantitative models across thousands of companies.
Quantitative Analysis at Company Level
- Revenue YoY / QoQ / TTM growth
- Operating & net income growth
- EPS growth trends
- CAGR over 3Y, 5Y and 10Y
- Sequential growth acceleration / deceleration
- Gross, operating, net & EBITDA margins
- Return on Equity (ROE)
- Return on Assets (ROA)
- Return on Invested Capital (ROIC)
- Asset, inventory & receivables turnover
- Capex intensity & trends
- Free cash flow yield
- Share buyback intensity
- Current ratio & quick ratio
- Debt-to-equity & interest coverage
- Net debt / EBITDA
- Working capital trends
- P/E (TTM & forward), EV/EBITDA, EV/Sales
- Price / Book, PEG ratio
- Market cap to revenue
- Beta vs market
- Revenue volatility & margin stability
- Earnings variability
- Leverage risk profile
Industry Benchmarking
Pre-built benchmarking reports covering profitability, growth, valuation, efficiency and management effectiveness, and financial strength across hundreds of industries, structured for risk, compliance, and financial crime teams, including AML and KYC workflows such as source of wealth validation, as well as quantitative analysts who require peer-validated, audit-ready comparisons without building from raw data. Designed for compliance, due diligence, onboarding, and investment analysis, these datasets enable consistent validation of financial profiles against industry benchmarks. Available as bulk data feeds.
- Company vs industry average margins
- Company vs sector growth rates
- Market share ranking
- Relative profitability percentile
- Rank within NAICS / SIC
- Industry revenue growth YoY / QoQ / TTM
- Industry operating income trends
- Profitability expansion by sector
- Sector cyclicality analysis
- SG&A as % of revenue vs peers
- R&D intensity vs peers
- Cost of goods trends
- Operating leverage comparison
- Market share shifts over time
- Customer concentration risk
- Supplier dependency exposure
- Segment contribution analysis
- Supplier revenue exposure
- Customer dependency risk
- Industry network centrality
- Revenue propagation across industries
Quantitative Models for Institutional & Hedge Fund Use
- Profitability & growth factor screening
- Leverage factor screening
- Margin expansion signals
- Industry-relative z-score models
- Earnings momentum signals
- Margin inflection detection
- Revenue acceleration models
- Relative strength vs fundamentals
- Composite financial health score
- Industry-adjusted performance index
- Quantile ranking across 10,000+ companies
- Multi-factor screening
- Sector allocation modeling
- Industry rotation signals
- Risk-adjusted return comparisons
- Capital efficiency ranking
Institutional Benchmarking Applications
- Benchmark profitability vs competitors
- Compare cost structure vs industry
- Evaluate market positioning
- Comparable company analysis
- M&A screening
- Deal valuation benchmarking
- Industry overweight / underweight decisions
- Factor-based portfolio construction
- Earnings cycle tracking
- Target screening
- Margin improvement benchmarking
- Exit multiple analysis
- Industry benchmarking reports
- Client performance dashboards
- Peer performance diagnostics
Data Integrity & Methodology
All three routes draw from the same underlying database, so the numbers are consistent whether you downloaded a CSV from the page, asked your assistant for an Excel file, or ingested the rows through the API.
- Data lineage sourced directly from standardized SEC filings
- Documented calculation methodology for revenue, profitability, growth, and ratio metrics
- Industry classifications: SIC, NAICS, ISIC, NACE, and custom peer-group mappings
- Standardized normalization ensuring cross-company and cross-period comparability
- Version-controlled exports suitable for audit and institutional compliance review
Executive & Regulatory Packages
These specialized packages support board reporting, regulatory submissions and sustainability analytics. Ask your AI assistant for them as a finished file, or pull the underlying data through the API.
Small Business & Professional Access
Independent analysts, boutique consulting firms and small funds do not need bulk data infrastructure. On an Individual or Professional subscription, your AI assistant produces the specific report you need, formatted for client delivery, and the website route stays available for the quick CSV. Professional adds the API when you are ready to build something of your own.
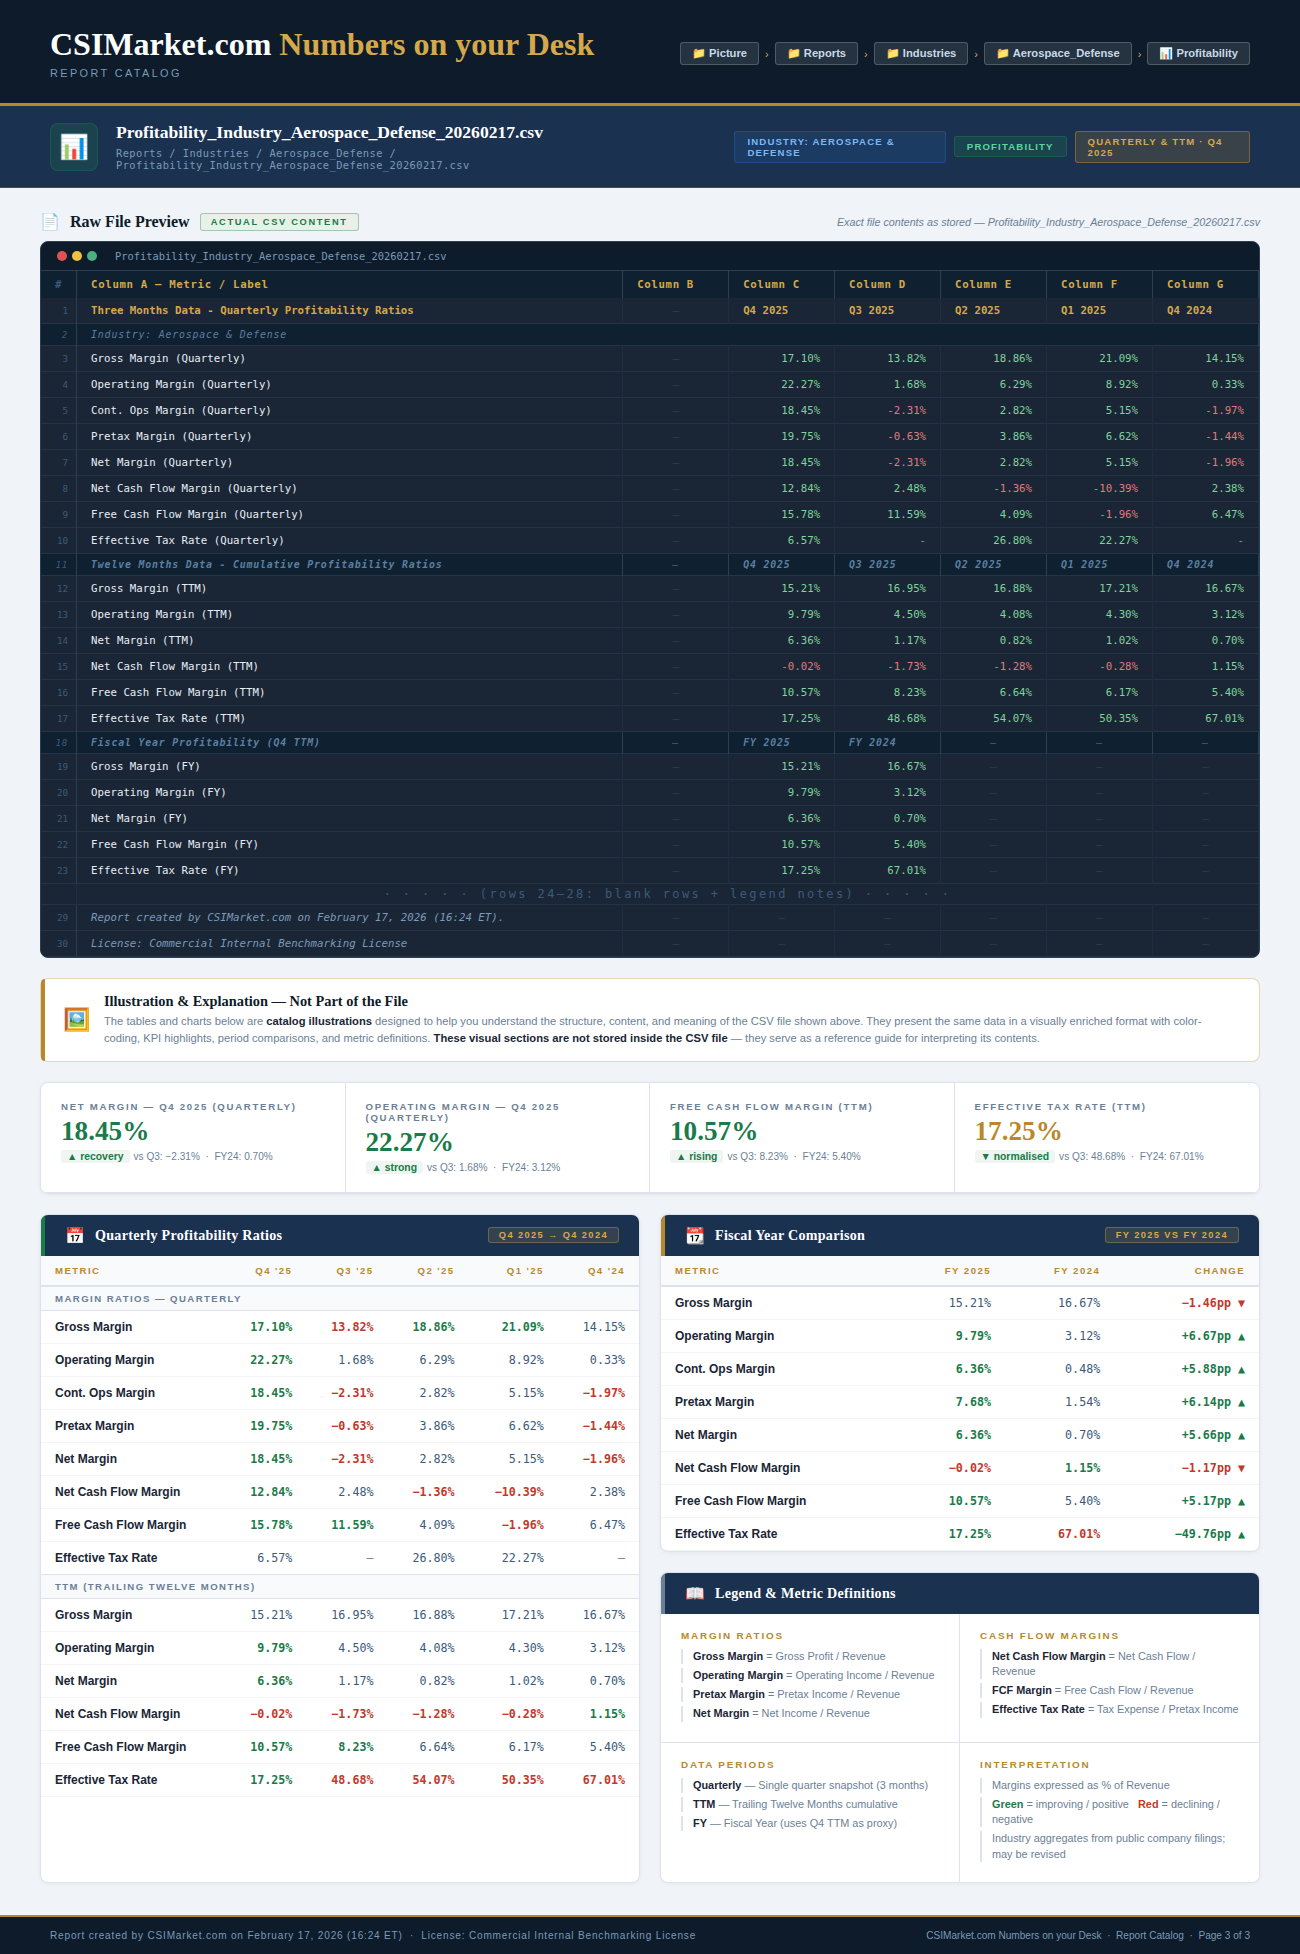
Example: formatted custom profitability benchmarking report.
Request Institutional Access
For whole-universe bulk downloads, AI and ML training datasets, redistribution, OEM embedding or organization wide deployment, contact our institutional data team. Tell us what you need to ingest and how it will be used, and we will scope it.
Compliance and Register of Information (ROI)
CSIMarket operates under a DORA, Digital Operational Resilience Act-aligned framework and maintains security controls aligned with ISO/IEC 27001 principles, as a ICT Third-Party Service Provider.
Contact: data.info@csimarket.comNot sure which route?
Reading and reporting: stay on the website and download the CSV.
Research that keeps changing shape: ask your AI assistant. You describe the file, it builds it, in Excel, PDF, CSV or JSON.
Something that must run unattended: use the API, from Professional up. For the whole universe in one pull, that is a bulk download on a commercial licence.